
KD Ranking.
Your binders titrated on the microarray. An apparent KD for each peptide, ranked from tightest to weakest.
What it answers
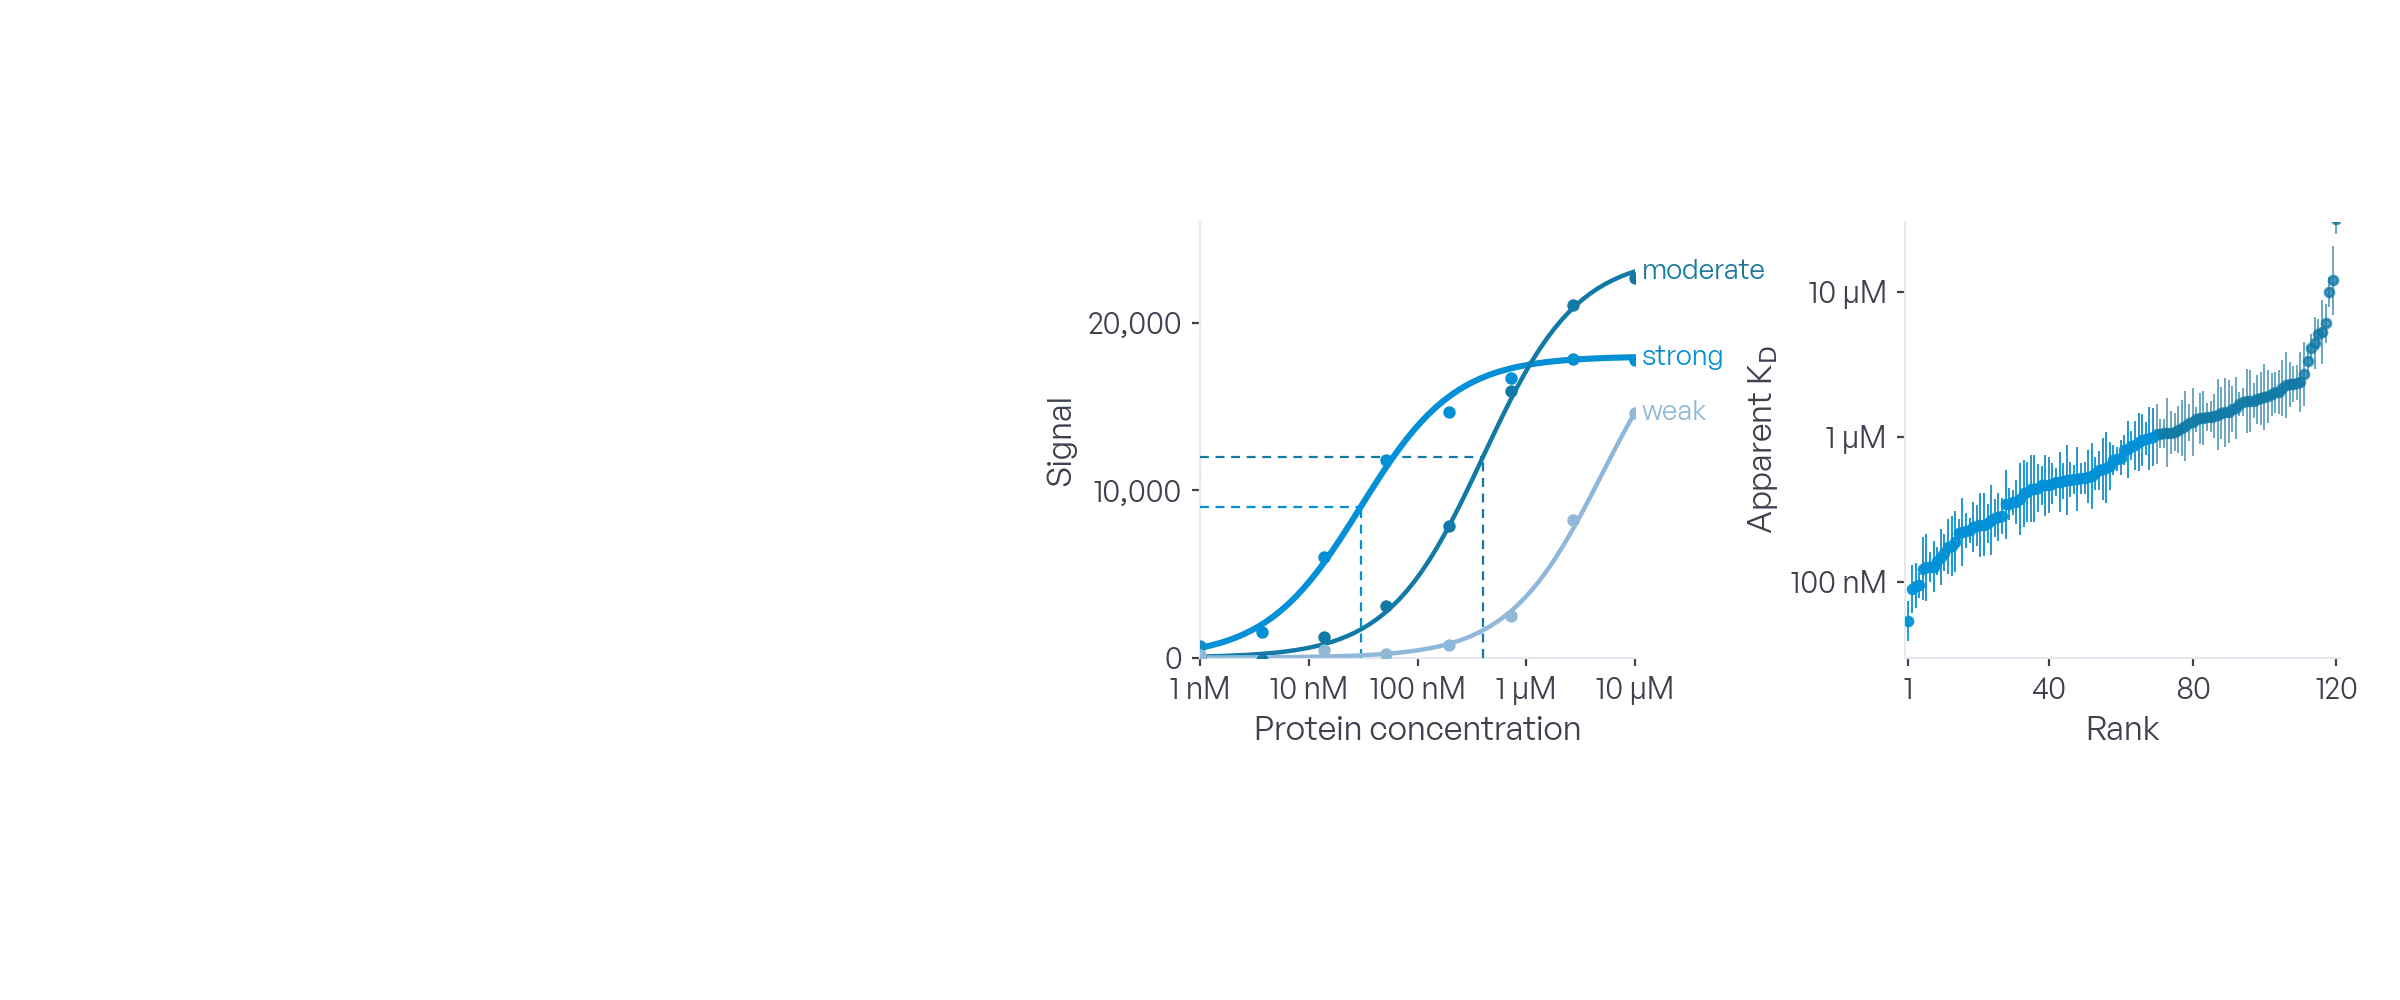
How strongly does each of my peptides bind the target protein? We synthesize the library in situ, up to 15,000 peptides per microarray in a six-well layout, and titrate the target protein over it, one concentration per well. A binding curve is fitted for every peptide. The result is a ranked table of binding affinities: an apparent KD for each peptide, with its confidence interval, fit quality and affinity class.
When to use it
Ranking predicted binders
Titration puts hundreds of model-proposed candidates in order of affinity, not only above or below a threshold.
Affinity training data
Real affinities for thousands of sequences from one experiment, to train or calibrate a model.
Cyclic versus linear
Display every core in both forms, walk the ring closure through the sequence, and see which change buys affinity.
Lead selection
Choose which candidates deserve individual synthesis and an SPR run, from data instead of intuition.
How the assay works
Day 0
1Project submission
Configure the library and submit the project by email.
Day 1–7
2Peptide synthesis
Your peptides are synthesized in situ on the microarray: up to 15,000 peptides in six wells, along with blank spots and synthesis controls. Larger libraries are screened first, and the binders are titrated in a second phase.
Day 8–10
3Titration
The target protein is incubated at six concentrations, one per well, on the same microarray, then the microarray is scanned.
Day 11–13
4Data analysis
A 1:1 binding curve is fitted for every peptide. The fit gives the apparent KD with a confidence interval, the fit quality and the Hill coefficient. Peptides that do not saturate are reported as bounds.
Day 14
5Project release
Raw data, processed results and the project report are released to you.
What you provide
Sequences
A list of sequences, including custom building blocks: unnatural or D-amino acids, cyclization by thioether, disulfide or amide. Or a library we derive from your sequences or a protein structure. Up to 25 residues per peptide.
Target protein
Purified. Labeled by you with a fluorophore or biotin, tagged for detection with a secondary antibody, or labeled by us. Enough for a concentration series. Amount and buffer are confirmed in the quote.
Assay conditions
Optional. Preferred concentration range, buffer and temperature, and reference values from solution-phase measurements. Otherwise we propose the series in the quote.
What we deliver
Raw data
Scanner exports and extracted signals for every spot at every concentration.
Processed results
KD summary and dose–response data: apparent KD with confidence interval, fit quality, Hill coefficient, affinity class and rank for every peptide, plus the signal at every concentration. Spreadsheet and CSV.
Project report
Design, protocol, quality control, ranked results with figures, cyclic-versus-linear or substitution comparisons where the design allows, and a data dictionary.
From a real project
Does cyclization drive the binding, and where should the ring close?
- Question
- A pharma customer wanted to rank cyclic binders to an intracellular protein and learn whether the ring, not the sequence, makes them bind.
- Design
- 8,448 peptides on one microarray. 199 cyclic cores, each walked through every ring-closure position, every core also as a linear peptide, plus 1,753 linear designs. Thioether cyclization. Six wells, one concentration each, from 0.1 nM to 10 µM of the biotinylated protein.
- Result
- 116 specific binders with apparent KD from about 0.19 µM to 36 µM. Of 99 cores where one form bound, 78 bound only as the cyclic peptide. Moving the ring closure changed the affinity up to six-fold. The values agreed with the customer's SPR window for the control peptides.
| Rank | Peptide | Form | Apparent KD | 95 % CI | Hill | Class |
|---|---|---|---|---|---|---|
| 1 | PEP-01886 | cyclic | 0.19 µM | 0.13–0.27 | 1.0 | moderate |
| 2 | PEP-02279 | cyclic | 0.21 µM | 0.15–0.29 | 1.1 | moderate |
| 3 | PEP-00223 | cyclic | 0.24 µM | 0.17–0.33 | 0.9 | moderate |
| … | ||||||
| 116 | PEP-01097 | cyclic | 36 µM | 21–62 | 1.0 | weak |
| — | PEP-01886 | linear | > 10 µM | — | — | non-binder |
Excerpt of the results table. Generic records, real columns.
Questions
Does KD Ranking need a directly labeled protein?
No, but it is recommended. KD Ranking also works with a tagged protein and a labeled secondary reagent after the incubation. During that staining step, weakly bound protein can dissociate from the surface. A direct fluorophore label skips the step, and more of the weak binders stay visible.
How much protein does a KD titration need?
It depends on the weakest affinity you want to resolve. To saturate the surface-bound peptides, the highest concentration of the series must lie well above that KD. Each well needs its concentration times its volume, summed over the series. The sample calculator in Learn (step 2.6) does the arithmetic. Your stock must be at least as concentrated as the highest well. If sample is limited, the series can be scaled down, at the cost of resolving only stronger binders.
What does "apparent" mean?
The KD is fitted from binding on a surface, with the peptide tethered and the protein in solution, and read after the detection reagent is added. Absolute values can differ from solution-phase measurements, in particular for fast-dissociating binders. The ranking is what the assay is built for. Confirm the top candidates in solution.
How does the ranking compare with SPR or BLI?
In projects with solution-phase reference values, the apparent KD of the control peptides fell within the customer's SPR window. Rank differences within overlapping confidence intervals are not resolved. Use the array to decide which candidates deserve an SPR run, not to replace it.
Which concentration range do you cover?
Six concentrations, one per well, set per project and typically spanning several orders of magnitude, from the low nanomolar to the micromolar range. Binders that do not saturate within the series are reported as bounds, not as values.
What if my protein binds as a dimer or cooperatively?
The fit reports a Hill coefficient for every peptide. Values far from 1 flag avidity or non-specific binding, and those peptides are classed separately instead of being ranked as if they were 1:1 binders.
Can KD Ranking be combined with Binder Identification?
Yes, and larger libraries require it. Up to 15,000 peptides are titrated directly. Above that, the library is screened by Binder Identification first, and the binders are titrated on a second microarray.
How many peptides can get an apparent KD in one experiment?
Up to 15,000 on one microarray. A titration needs every peptide in each of six wells, one protein concentration per well, so the library is the size of one well. The 200,000 peptides of the one-well layout meet a single concentration: one signal per peptide, a screen, not a titration.
Can a titration have more than six concentrations?
Yes. Six is the minimum, and it keeps the library large, up to 15,000 peptides. For a finer ranking, the series can run over up to 18 wells, on fewer peptides per well.
Bring your target and your question
We will propose a library, a layout and a timeline within one business day.