
Inside the automated lab.
Peptide microarrays, from synthesis to data, in five short chapters.
- 1How we synthesize peptidesFrom a glass slide to a finished library, ready for the assay.
- 2How we run the assayWhat happens between the finished array and the scan.
- 3How we analyze and present the dataFrom the scan to the tables you receive.
- 4How to configure a projectThe choices you make before the array is synthesized.
- 5Running assays in your own labFor labs that order the arrays and run the assay themselves.
One slide, one peptide per spot
What is a peptide microarray?
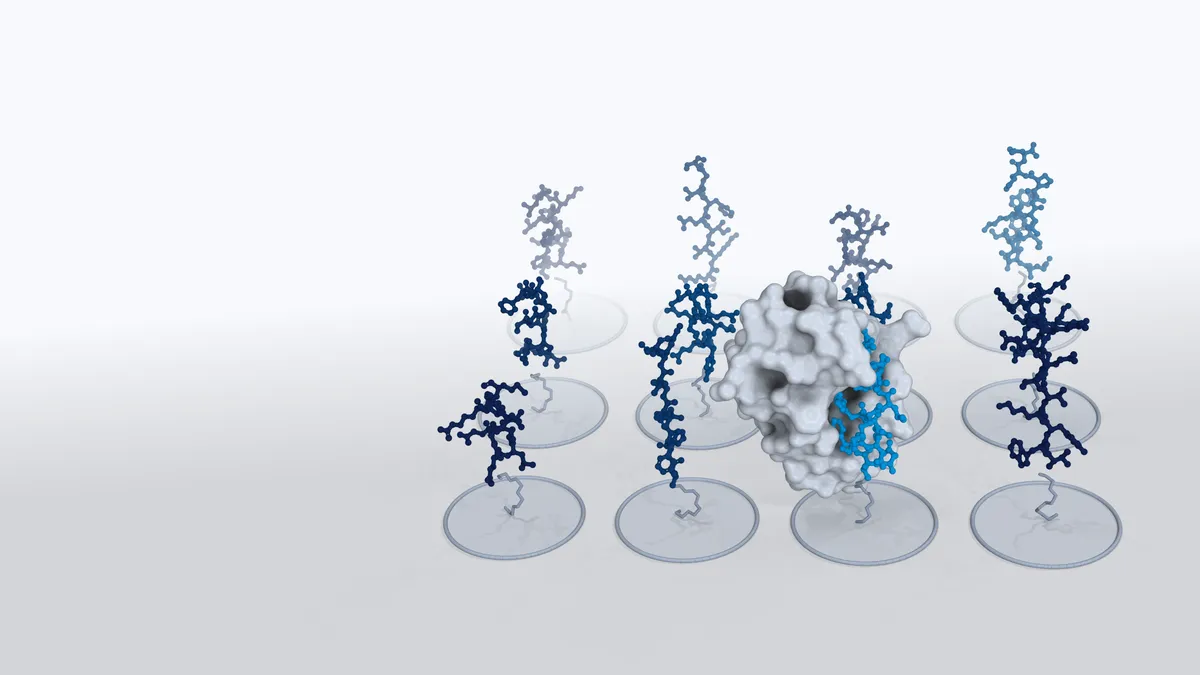
A peptide microarray is a 25 × 75 mm glass slide covered with spots, each carrying many copies of one peptide sequence. The position of a spot identifies its peptide, so every signal maps back to a sequence.
- Up to 200,000 peptides per array. Each sits in its own spot of about 40 × 40 µm.
- Tethered peptides, protein in solution. The peptides are fixed to the surface; the target protein is added in solution and stays where it finds a partner.
- One spot, one measurement. One peptide replica tested against one protein under one condition is one datapoint; replicate spots give several per peptide.
Switch between the slide, its spot area and one spot. Spot count and spacing are schematic.
Questions about this step
Does 200,000 peptides mean 200,000 different sequences?
It means 200,000 spots, one sequence each. A peptide shown in duplicate takes two spots, so replicates share the capacity: 100,000 different sequences in duplicate fill the same microarray.
Synthesized in place, all at once
How are the peptides made?
The peptides are synthesized directly on the slide, residue by residue, not made elsewhere and spotted. All spots grow in the same coupling cycles on our own automated synthesizer.
- Maskless photolithography. In each cycle, a light pattern set without a physical mask selects the spots that receive the next amino acid.
- Conventional Fmoc chemistry. Solid-phase peptide synthesis, from the C-terminus to the N-terminus.
- Library size does not lengthen the run. Every peptide grows in the same cycles, so a large library takes no longer than a small one.
Synthesis takes Day 1–7 of the day plan.
Step through three coupling cycles: light selects the spots, and the amino acid couples only there. Schematic.
Questions about this step
Are the peptides spotted onto the slide or synthesized on it?
Synthesized on it. Each peptide is built residue by residue on the coating of the slide, in situ, instead of being made separately and spotted. All peptides of the library are built in the same run.
In which direction are the peptides synthesized?
From the C-terminus to the N-terminus, by conventional Fmoc chemistry. The C-terminus is bound to the surface. The N-terminus is the free end, where a label or reporter goes when the design has one.
Two coatings, one anchor
Which surfaces do you use, and how are peptides attached?
The first amino acid of every peptide couples to an amino group of the slide’s coating, its anchor. We use two coatings and select the one that suits the project’s scope.
- 3D polymer coating. Polymer chains carry the anchor groups and hold the peptides away from the glass, with far more anchor groups than a flat surface.
- 2D amino-silane surface. A flat surface with its anchor groups directly on the glass.
- A spacer in between. By default β-alanine–aspartate–β-alanine, which can be extended or replaced.
Switch between the two coatings. Schematic, not to scale.
Questions about this step
What connects the peptide to the surface?
A three-residue spacer, β-alanine–aspartate–β-alanine, at the C-terminus of every peptide. On the 3D coating it sits on polymer chains that already hold the peptide away from the glass. The spacer offsets the charge of the amine-bearing surface and reduces non-specific binding of the protein to it. You can extend it or replace it with a spacer of your own.
How dense are the peptides on a spot?
The 3D coating carries about 2.5 nmol of anchor groups per cm². Not every anchor yields a peptide the target protein can reach. Depending on the size of the protein, the accessible density can be below 0.25 nmol per cm².
Can the peptide density of a spot be lowered?
Yes, per sequence. The share of anchor groups that carries the peptide is set to 100, 50, 25, 10, 5 or 2 %. A dilution series of one sequence shows whether its signal depends on density, which points to avidity rather than 1:1 binding.
26 building-block slots
Which amino acids and modifications can I use?
One synthesis offers 26 building-block slots, split freely between standard and custom building blocks. Any commercially available Fmoc-protected amino acid with a free carboxyl group can fill a slot, sourced per project.
- Beyond the 20 standard amino acids. D-amino acids, norleucine, N-methyl amino acids or citrulline, for example.
- Up to 25 residues per peptide, not counting the spacer.
The 26 slots with standard building blocks only or with custom ones, and one peptide built from them.
Questions about this step
Can the library contain unnatural amino acids or cyclic peptides?
Yes. Any commercially available Fmoc-protected amino acid with a free carboxyl group, sourced per project, including D-amino acids. Cyclization by thioether, disulfide or amide. Up to 25 residues. Stabilizing modifications are tested in the same run as the unmodified sequence.
How many different building blocks can one synthesis use?
26 in total, split freely between standard and custom building blocks, including any spacer or reporter the project needs. Most projects need no reporter, and the spacer can be adjusted. A library that uses all 20 standard amino acids therefore has room for up to six custom ones.
What must a custom building block carry?
An Fmoc-protected amino group, a free carboxyl group, and an acid-labile protecting group, such as tBu, Trt or Boc, on any side chain that could react during synthesis.
How long can a peptide be?
Up to 25 residues, plus the spacer. Synthesis yield depends on the sequence more than on the length alone. For long or difficult sequences, a reporter at the N-terminus shows the relative yield of each peptide (step 1.5).
Can glycosylated amino acids be used?
Rarely. Glycosylated building blocks are bulky and couple with low yield. Where one is available with Fmoc and side-chain protection, it can be tried as a custom building block.
Termini and labels
How are the ends of a peptide finished?
The C-terminus of each peptide is bound to the surface through the spacer. The N-terminus is the free end, finished per peptide.
- Acetylated by default. One capping step acetylates the N-termini of the whole library.
- Free where you need it. Free and acetylated N-termini share one array.
- Labels and reporters. Biotin, desthiobiotin or a fluorophore on the N-terminus, coupled as a building block.
Peptides cyclized by thioether carry the ring closure on the N-terminus instead (step 1.6).
One peptide from spacer to N-terminus, with the four possible finishes of its free end. Schematic.
Questions about this step
Are the peptides acetylated?
By default, yes. The N-terminus of every peptide is acetylated, and the C-terminus is bound to the surface through the spacer. Peptides are linear unless the design asks for cyclization.
Can free and acetylated N-termini be mixed on one microarray?
Yes. Peptides to be acetylated are marked in the sequence list by an N-terminal [Ac] residue, and the acetyl group then counts as one residue toward the peptide length. Acetylating the whole library is a single capping step instead and does not count toward the peptide length.
Can the peptide carry a label or reporter?
Yes, at the free N-terminus: biotin, desthiobiotin or a fluorophore, coupled as a custom building block. A reporter at the end of the chain makes the relative synthesis yield of each peptide visible. In Protease Profiling, its loss marks the cut (step 3.4).
Cyclization
How are peptides cyclized, and why?
A ring holds a peptide in shape. Cyclization is set per peptide: thioether, disulfide or amide (head-to-tail, side-chain-to-side-chain).
- Thioether is the default. After synthesis, a cysteine near the C-terminus closes the ring with the N-terminus.
- Linear and cyclic side by side. Both forms, and peptides of different lengths, share one array, so a core can be tested in both forms and its ring closure moved along the sequence.
- Why cyclize. A constrained peptide can bind where its linear form does not.
One peptide, linear or closed into a ring by a thioether, disulfide or amide bond. Schematic.
Questions about this step
Does cyclization hide binders?
No, it tends to reveal more. A ring loses less conformational entropy on binding than a flexible linear peptide, so it binds more strongly, and weaker binders become visible. In one KD Ranking project, 78 of 99 cores that bound did so only as the cyclic peptide.
Can peptides be stapled or clipped?
Not at present. Ring closures that need an external reagent, such as ring-closing metathesis or a chemical clip, are not offered. Thioether, disulfide and amide rings are.
Can one spot hold linear and cyclic copies of the same peptide?
Yes. Partial cyclization leaves each spot with a mix of linear and cyclized copies of the same sequence.
Does head-to-tail cyclization need an extra building block?
Yes. Head-to-tail amide cyclization needs one extra building block at the C-terminus. It takes one of the 26 building-block slots and adds one residue to the ring.
Checked before the assay
How do you know the synthesis worked?
Every microarray carries synthesis controls next to the library. A stain with anti-tag antibodies reads them before any result is trusted.
- Tag controls. Known antibody epitopes, each with sequence variants, show whether the synthesis built them.
- Across the whole slide. The controls sit in a fixed frame and grid in every block, so the stain also shows whether the signal is uniform.
- Rings confirmed. Control peptides that bind only in cyclic form confirm the ring closure.
Antibody stain of the synthesis controls in every block. Illustrative.
Questions about this step
Which controls are on every microarray?
Synthesis controls, read with an antibody stain, in a fixed frame and grid in every block, and blank spots without peptide. Controls for your assay, positive or negative, are part of your library (step 4.3).
Is the synthesis check part of the report?
Yes. The project report includes the quality control of every microarray: the synthesis controls and the uniformity of the signal across the slide.
The assay in one picture
How does a peptide-array assay work?
The finished microarray is blocked, incubated with the target protein, washed, stained if the protein carries a tag, and scanned. The assay takes Day 8–10 of the day plan.
- Up to 18 conditions on one array. Each well holds one condition: a protein, a concentration, a buffer or a contact time.
- The question sets the design. One read for Binder Identification or Epitope Mapping, a concentration series for KD Ranking, a contact-time series or a protease titration for Protease Profiling.
- Protease Profiling runs the other way round. No blocking; the scan reads the reporter each peptide kept.
Block, incubate, wash, detect, scan: step through the stages. Schematic.
Questions about this step
Is the surface blocked before the assay?
For binding assays, yes: a blocking buffer covers the surface before the protein is added. For Protease Profiling, no: the protease meets the peptides in its own buffer.
Baseline first
What is measured before the analyte is added?
Before the target protein touches the microarray, a reference scan records what binds without it. Every later signal is read against this baseline.
- The detection reagent alone. The reference scan shows which peptides bind the staining reagent itself.
- Blank spots. Spots without peptide record what binds to the coating, and that signal is removed.
- Only the difference counts. A peptide binds the protein only where its signal rises above both.
Switch between the reference scan and the scan after the protein. Dashed rings are blank spots. Illustrative.
Questions about this step
Why scan the microarray before the protein is added?
In binding assays, the reference scan shows what binds without the target protein: the detection reagent alone, on the peptides and on the coating. Each peptide's signal after incubation is read against it, so a peptide that binds the detection reagent is not mistaken for a binder of the protein. Protease Profiling uses a buffer-only well as its reference instead.
Read-out: fluorescence
How is binding detected?
Binding is read as fluorescence: from a dye on the protein itself, or from a labeled secondary reagent that binds the protein’s tag.
- Red first. At 635 nm, peptides and coating glow least, so the background is lowest.
- More colors, more readouts. Green (532 nm) and blue (488 nm) add a second or third signal in the same incubation.
The same spots in the blue, green and red channel. The background falls toward red. Illustrative.
Questions about this step
Which fluorescence channel is used?
Red, around 635 nm, whenever the design allows, because peptides and coating fluoresce least there. Green, at 532 nm, serves a second readout in the same incubation, for example IgM in green next to IgG in red. Blue, at 488 nm, is a third, with the highest background.
Can I use an HRP-conjugated secondary antibody?
No. The scanner reads fluorescence, not chemiluminescence. Use a secondary antibody labeled with a fluorophore that is read in the red channel.
Do the peptides fluoresce on their own?
Barely in the red channel. In the green and blue channels, aromatic residues add a noisy background: tryptophan most, then tyrosine and phenylalanine.
The analyte: a tag or a label
What must my protein or antibody carry?
The target protein needs something the scanner can see: a tag that a labeled reagent recognizes, or a fluorophore of its own. If it has neither, we label it.
- A tag. Biotin, read with labeled streptavidin, or an HA, FLAG or Myc tag, read with a labeled anti-tag antibody.
- A direct label. A fluorophore on the protein skips the staining step, which keeps weak binders visible.
- Antibodies. For Epitope Mapping, antibodies are read with a labeled secondary antibody or labeled directly.
Three ways to see the protein: biotin and streptavidin, a tag and an anti-tag antibody, or a dye on the protein. Schematic.
Questions about this step
Do I need to label my protein?
No. Send it labeled with a fluorophore or biotin, tagged for detection with a secondary antibody, or let us label it. Amount and buffer are confirmed in the quote.
Which tags can you detect?
Biotin, including a biotinylated Avi-tag, read with labeled streptavidin. HA, FLAG and Myc tags, read with labeled anti-tag antibodies. A mono-biotinylated protein is the most common format. A truncated construct needs the same tag as the full-length protein.
Does KD Ranking need a directly labeled protein?
No, but it is recommended. KD Ranking also works with a tagged protein and a labeled secondary reagent after the incubation. During that staining step, weakly bound protein can dissociate from the surface. A direct fluorophore label skips the step, and more of the weak binders stay visible.
What do you need from me to label my protein?
Its molecular weight and extinction coefficient. We can usually derive the coefficient from the sequence. The formulation should contain no other protein, such as BSA; we confirm the buffer with you. A certificate of analysis helps but is not required.
Which dye should I use if my protein is labeled elsewhere?
A dye read in the red channel, around 635 nm. Charged dyes and excess dye cause non-specific binding to the peptides, so we agree the dye and the degree of labeling with you before the protein is labeled.
Can you detect a His-tagged protein?
Not reliably. On a peptide array, anti-His detection gives a background that masks the protein's binding. Use biotin, an HA, FLAG or Myc tag, or a direct label instead.
Buffers and conditions
Which buffer and conditions do you use?
Each well carries its own condition, so buffer, pH, medium or contact time can change across one microarray. Without a preference of yours, we use our defaults.
- Binding assays. Incubated overnight at 4 °C by default.
- Protease assays. At 37 °C, in plasma, serum, or a protease in its buffer.
Six wells, six conditions on one microarray: switch the variable. Schematic.
Questions about this step
Which buffer and conditions do you use by default?
PBS with Tween 20 (PBST), incubated overnight at 4 °C. If you have conditions of your own, we use them instead, which also keeps the results comparable with earlier assays.
Can you use the buffer from my SPR assay?
Yes. Conditions from SPR, TR-FRET or similar methods can be reproduced on the microarray. HBS also works as an incubation buffer.
Which buffer should my protein come in?
The one it is most stable in, where it is least prone to aggregation. Glycerol, sugars and surfactants do not affect the assay, and the formulation does not affect the microarray. If we label the protein, see step 2.4 for what to leave out.
Plasma, buffer or a purified protease?
All three. A purified protease in its buffer gives its specificity motif. Plasma or serum gives the stability that matters for a therapeutic candidate. Buffer series across pH show where an enzyme is active, and let you emulate the compartment your peptide must survive. One microarray holds up to 18 conditions.
How much sample
How much analyte do I need?
The amount follows from three numbers: the volume each well takes, the concentration in each well, and the molecular weight.
- The layout sets the volume. From 2 mL for one condition over the whole slide down to 80 µL per well in the 18-well layout.
- Screens and titrations differ. A screen runs at one concentration; a KD titration must reach well above the weakest KD it must resolve.
- Sera by dilution. Sera and plasma are dosed at 1:1000 to 1:100.
The quote confirms the amount and the buffer for your project.
Volumes per well as prepared in the lab, each plus 10 µL for pipetting. Guide values.
Questions about this step
How much sample volume does each well need?
A single condition over the whole slide takes 2 mL. Two wells take 200 µL each, six wells 150 µL, 12 wells 100 µL and 18 wells 80 µL. Each well is prepared with 10 µL extra for pipetting.
How much protein does a KD titration need?
It depends on the weakest affinity you want to resolve. To saturate the surface-bound peptides, the highest concentration of the series must lie well above that KD. Each well needs its concentration times its volume, summed over the series. The sample calculator in Learn (step 2.6) does the arithmetic. Your stock must be at least as concentrated as the highest well. If sample is limited, the series can be scaled down, at the cost of resolving only stronger binders.
How much antibody do I need for Epitope Mapping?
Send at least 20 µg of each antibody, or 50 µg if sample is not limited. The sample calculator in Learn (step 2.6) shows the amount per well for any concentration, and the quote confirms the one for your project.
How should I ship the protein?
Frozen on dry ice in most cases. IgGs and nanobodies can also travel at 4 °C. Follow the supplier's recommendation for your protein, and use an express courier.
From scan to one row per peptide
What happens to the raw scan?
The scanner records the signal of every spot. The analysis turns the spots into one row per peptide, on Day 11–13 of the day plan.
- Grid. The image is aligned on the control spots, and each position names its peptide.
- Background. Uneven background across the slide is corrected where the data call for it.
- Replicates. Outlier spots are flagged and kept on record; the others make up the peptide’s row.
Three replicate spots of one peptide become one row. Illustrative.
Questions about this step
Are the analysis results reproducible?
Yes. The analysis is a fixed, deterministic program: the same scans and library give the same numbers. Each delivered run is archived with its program version and settings, so it can be rerun later with identical results.
How is the scan matched to the peptides?
Through the grid. Control spots in a fixed frame and grid mark every block, and the image is aligned on them. Each spot's position then names its peptide. Usually the protein's own signal on the controls is enough for alignment. Otherwise the controls are stained separately.
What happens to outlier spots?
They are flagged and left out of the peptide's value. They stay in the spot data you receive, so every exclusion can be checked.
Bound or not
How is a peptide called a binder?
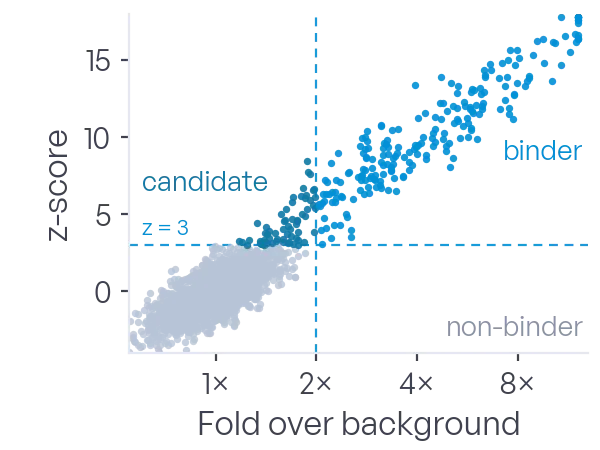
Every peptide is tested against the blank spots and the reference scan. Its replicates are combined into one call, with the false-discovery rate controlled across the whole library.
- Four calls. Binder, candidate, secondary binder or non-binder.
- Epitope Mapping adds a layer. The calls are then mapped onto the protein (step 3.5).
Point at a spot to see its row in the result table. Generic values.
Questions about this step
How do you decide that a peptide is bound?
Each peptide is compared with blank spots and with a scan taken before the target protein is added. It is called bound when its replicates lie significantly above that background, reported as a z-score and a false-discovery rate. The fold over background is reported with it.
What is a candidate?
A peptide whose signal is above background, but whose call is less certain than a binder's by the false-discovery rate. Candidates are listed apart from the binders, not mixed in with them.
What if the secondary reagent binds a peptide?
Then the peptide is a secondary binder. It binds the staining reagent, not the target protein, and is kept out of the calls for the protein. The reference scan identifies it. In a titration, its signal does not rise with the protein concentration.
Do peptides bind because of their sequence or their charge?
The analysis tests that. Binding is correlated with peptide properties across the library: charge, hydrophobicity and aromatic content. A strong correlation points to binding driven by those properties, a weak one to sequence-specific binding.
Apparent KD
How is affinity measured?
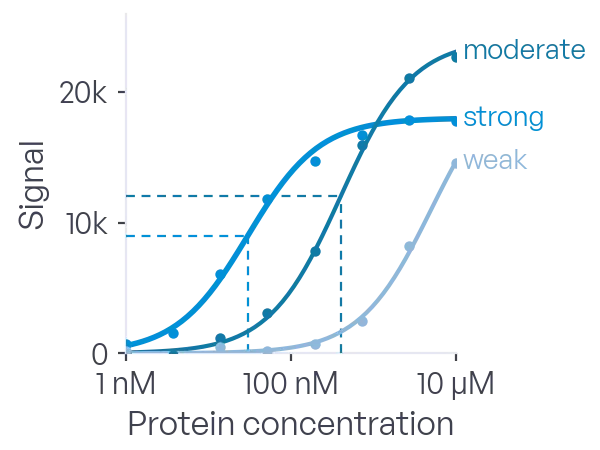
A concentration series on one microarray, one concentration per well. For every peptide, one binding curve is fitted to its signal across the wells.
- What the fit gives. The apparent KD with its 95 % confidence interval, the Hill coefficient and the fit quality.
- Ranked by KD. A peptide that binds but does not saturate within the series is reported as a lower bound; a fit that fails is flagged, not ranked.
- Read through the intervals. Two peptides whose intervals overlap are not reliably ordered.
Apparent KD from on-array titration: the peptide is tethered and the protein in solution, so values may differ from solution-phase measurements.
Six concentrations, one per well. Move the yield: the curve scales, the KD stays. Illustrative.
Questions about this step
Does a stronger signal mean a stronger binder?
Not reliably. An end-point signal depends on synthesis yield and off-rate as much as on affinity. To rank binders, add KD Ranking: a concentration series on the same microarray gives an apparent KD for every peptide.
What does "apparent" mean?
The KD is fitted from binding on a surface, with the peptide tethered and the protein in solution, and read after the detection reagent is added. Absolute values can differ from solution-phase measurements, in particular for fast-dissociating binders. The ranking is what the assay is built for. Confirm the top candidates in solution.
How does the ranking compare with SPR or BLI?
In projects with solution-phase reference values, the apparent KD of the control peptides fell within the customer's SPR window. Rank differences within overlapping confidence intervals are not resolved. Use the array to decide which candidates deserve an SPR run, not to replace it.
Which concentration range do you cover?
Six concentrations, one per well, set per project and typically spanning several orders of magnitude, from the low nanomolar to the micromolar range. Binders that do not saturate within the series are reported as bounds, not as values.
What if my protein binds as a dimer or cooperatively?
The fit reports a Hill coefficient for every peptide. Values far from 1 flag avidity or non-specific binding, and those peptides are classed separately instead of being ranked as if they were 1:1 binders.
What does a KD reported as "> 10 µM" mean?
The peptide binds, but the series never reached its midpoint. The true KD is at least the reported bound. A higher top concentration in the next series would measure it.
What is the weakest KD you can measure?
It depends on the protein more than on the array. The highest concentration must lie well above the KD to saturate the surface-bound peptides, so the limit is set by how soluble the protein is and how much of it you have. Binders weaker than the series allows are reported as lower bounds.
Half-life
How is stability against proteases measured?
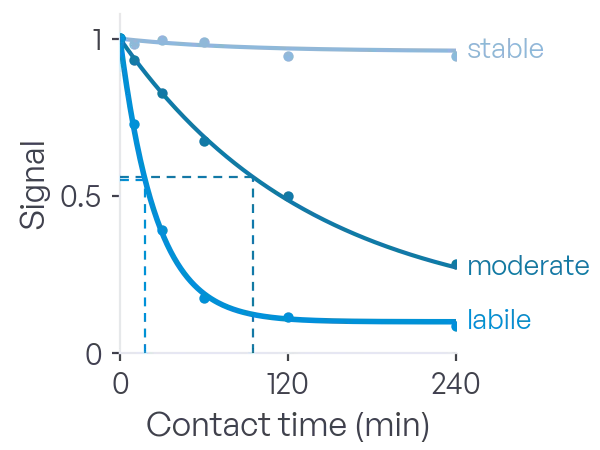
Each well is exposed to plasma, serum or a protease for its own contact time, next to a 0-minute well that saw buffer only. A cut removes the reporter, so a cleaved peptide loses its signal.
- One curve per peptide. A decay model gives the half-life with its 95 % confidence interval and the loss relative to the start.
- Ranked by half-life. Stable peptides, cleaved ones by speed, and those outside the tested times as bounds.
- Cleavage motifs. Comparing cleaved and uncleaved sequences shows which residues favor or hinder the cut.
- Or a protease titration. Varying the protease concentration at one contact time gives an apparent EC50 per peptide.
Three peptides losing signal at different rates, and the motif behind the ranking. Illustrative.
Questions about this step
How is cleavage measured on a microarray?
Every peptide carries a reporter at its free end. When a protease cuts the peptide, the reporter is released and the spot loses its signal. One well receives assay buffer only and is the null: each treated well is measured against it, and reference spots inside every well correct for well-to-well differences. One scan after the exposure is enough.
Half-life or apparent EC50?
Both are available, and the wells decide which. Vary the contact time and the fit gives a cleavage rate and a half-life per peptide: the question is how long a peptide survives. Vary the protease concentration at one contact time and the fit gives an apparent EC50, the concentration that cleaves half of it: the question is how little enzyme it takes. Both are rankings on a surface, not solution constants.
How are the cleavage motifs derived?
By comparing the sequences of cleaved and uncleaved peptides position by position, as a sequence logo. The assay ranks substrates and derives the motifs from the ranking. It does not localize the cut site within a peptide.
How do I read the cleavage-motif logo?
Each position shows the residues that favor cleavage above the axis and those that hinder it below. The height of a letter is its importance at that position.
Is the half-life absolute?
No, and neither is the apparent EC50. The peptide is tethered to the surface, so both are rankings under the chosen condition, not solution constants. Overlapping confidence intervals are not ordered. Confirm the leads in solution, for example by LC-MS.
How does on-array Protease Profiling compare with an LC-MS stability assay?
They fit different stages. LC-MS follows the intact peptide and its fragments in solution, so it gives a solution half-life and the cut site. It is the better choice for the last few candidates. The array compares up to 15,000 peptides on one microarray, all in the same plasma or protease, and ranks them with the motifs behind the ranking. On the array the C-terminus is anchored, so carboxypeptidases cannot reach it; in solution they can. The array narrows the library; LC-MS confirms the leads.
Is every loss of signal a cut?
Not necessarily. Fouling by the sample, or enzymes that strip the reporter, also lower the signal. A fluorescent label also changes brightness with the peptide's charge and the sample matrix. A heat-inactivated sample run alongside separates proteolysis from such losses. Without it, the result is each peptide's susceptibility to signal loss in that matrix, and differences between related sequences point to the enzyme.
What does "stable" mean?
That the peptide lost no measurable signal over the tested window. It is a bound, not proof: the half-life is longer than the window. A longer time series would measure it.
Epitopes
How is an epitope read from the array?
For each antibody, every candidate peptide is called as in step 3.2. The hits are then mapped back onto the target protein.
- Continuous epitopes. Overlapping hits merge into one stretch with its core residues.
- Discontinuous epitopes. Two-fragment and surface-patch hits that the continuous call does not explain.
- On the structure. Each antibody’s epitopes are drawn on the structure, in an interactive 3D viewer.
- Across proteins and antibodies. Every peptide carries the names of all library proteins it occurs in, and a specificity table compares the wells.
Loading the 3D model …
one stretch of the sequence
["one stretch of the sequence","two stretches, far apart in the sequence, side by side in the fold","residues from several stretches, next to each other on the surface"]Drag to turn the model. Lysozyme, a model antigen; the epitopes are illustrative.
Questions about this step
What if the antibody needs the folded protein?
Some antibodies bind an extended surface that no peptide reproduces, and the map stays empty for them. The result is then a validated negative, with the control peptides bright, and we say so. It is worth knowing before a crystallography campaign.
Can you map sera or polyclonal samples?
Yes. Sera and pooled samples are run like antibodies, one per well, and the map lists every candidate the sample recognizes across the whole antigen panel. Individual donors need individual wells.
How reliable is an epitope drawn on an AlphaFold model?
As reliable as the model at that spot. The map flags epitopes in low-confidence regions, fragments farther apart than the structure allows, and residues buried in the fold. These checks are advisory: distances from a model are not experimental contacts.
What you receive
What files and report do I get?
Every project delivers three parts on Day 14: raw data, processed results and the project report.
- Raw data. The scanner exports, the extracted signal of every spot and the peptide library.
- Processed results. Workbooks with one row per peptide and the spot data, as spreadsheet and CSV, with the QC figures and, for Epitope Mapping, the 3D figures.
- Project report. Design, protocol, quality control, the results with figures and a data dictionary, as a document and a PDF.
Raw data, processed results, project report.
Questions about this step
Is the analysis included, or only raw data?
Included. Processed results are workbooks with one row per peptide, plus the QC figures. The report explains the design, the quality control and the results, and a data dictionary defines every column.
Can I analyze the raw data myself?
Yes. The scanner exports of every spot are part of the delivery, with the peptide library and the spot-level table, so the analysis can be redone or extended.
Can you share a sample report?
Not from another project: reports fall under confidentiality agreements. Each service page shows an excerpt of a results table with the real column names. The report itself covers design, protocol, quality control, the results with figures, and a data dictionary.
Which question are you asking?
Which assay answers my question?
Four questions, four assays. Many projects combine two: a screen first, then a titration of the binders.
- Which of my peptides bind? Binder Identification: bound or not, per peptide.
- How strongly? KD Ranking: an apparent KD per peptide.
- Where on the protein? Epitope Mapping: the epitopes on the structure.
- How stable against proteases? Protease Profiling: a half-life or an apparent EC50 per peptide.
Which of my peptides bind?
A bound-or-not call for each peptide in the test library, with statistical confidence.
How strongly do they bind?
An apparent KD for each binder from one on-array titration, ranked from tightest to weakest.

Where on the protein?
Continuous and discontinuous epitope candidates, derived from the structure of the target protein and tested on one peptide microarray.
How stable is it against proteases?
A cleavage rate and a half-life for each peptide in plasma or against a protease, and the cleavage motifs behind them.
Four questions and what each assay returns.
Questions about this step
Can KD Ranking be combined with Binder Identification?
Yes, and larger libraries require it. Up to 15,000 peptides are titrated directly. Above that, the library is screened by Binder Identification first, and the binders are titrated on a second microarray.
What separates Binder Identification from Epitope Mapping?
Where the library comes from, and what the result says. Binder Identification screens the library you send and calls each peptide bound or not. Epitope Mapping derives the candidates from the target protein's sequence and structure, and maps the hits back onto that protein.
Peptide array or phage display: which fits my question?
They answer different questions. Phage display, like mRNA display, selects from a random library far larger than any array and returns the sequences enriched over the selection rounds. It is the better choice when there is no starting sequence and you need a binder from scratch. A peptide microarray tests a library you define, up to 200,000 peptides per array, and measures every peptide, binders and non-binders alike. It fits when the candidates already exist: designed by a model, variants of a lead, or tiles of a protein sequence. Many programs use both: display to find a hit, the array to map and optimize it.
Layouts and capacity
How many peptides and conditions fit?
One microarray holds one to 18 conditions, one per well. The more wells, the fewer peptides per well.
- Five layouts. One, two, six, 12 or 18 wells.
- Titrations and protease series. KD Ranking and Protease Profiling run in multi-well format on up to 15,000 peptides.
- Beyond one array. Up to 500,000 peptides per project from 14 days, on three arrays in parallel; larger projects on request.
Pick a layout: every well holds the same number of peptides.
Questions about this step
Which layouts are available?
- 1 well: 200,000 peptides
- 2 wells: 70,000 peptides each
- 6 wells: 15,000 peptides each
- 12 wells: 5,000 peptides each
- 18 wells: 3,200 peptides each
How large can a project be, and how many conditions fit on one microarray?
Up to 500,000 peptides per project from 14 days, on three microarrays in parallel; larger projects on request. One microarray holds from one condition with 200,000 peptides to 18 conditions with 3,200 peptides each: proteins, concentrations, buffers or controls.
How many antibodies fit on one microarray?
One per well, up to 18 on one microarray, each seeing the identical candidate library, plus a buffer well as reference. Larger panels span several microarrays.
Does every well carry the same library?
Your choice. Each well can carry its own library or a copy of another well's. Copies get the identical allocation of spots. Separate microarrays with identical content are possible too.
How many peptides can get an apparent KD in one experiment?
Up to 15,000 on one microarray. A titration needs every peptide in each of six wells, one protein concentration per well, so the library is the size of one well. The 200,000 peptides of the one-well layout meet a single concentration: one signal per peptide, a screen, not a titration.
Can a titration have more than six concentrations?
Yes. Six is the minimum, and it keeps the library large, up to 15,000 peptides. For a finer ranking, the series can run over up to 18 wells, on fewer peptides per well.
Replicates and controls
How many copies per peptide, and which controls?
Each peptide appears in several spots, placed at random across the slide. Your controls go into the library like any other peptide.
- Random, reproducible positions. A gradient on the slide spreads over all peptides, and the same library always gets the same positions.
- Your controls and ours. Positive and negative controls come with your library; the synthesis controls are ours (step 1.7).
- A buffer-only well. The negative control of the whole assay.
Three replicates of each of three peptides at random positions, and a gradient none of them falls into entirely. Illustrative.
Questions about this step
How many replicates should each peptide have?
At least two, ideally three, per peptide and condition. Where candidates are ranked by priority, the count can be tiered: more copies for the likeliest candidates, and single spots for the rest when capacity is short.
Can different peptide lists have different replicate counts?
Yes: one list in duplicate, another in single spots, a control at its own count. New candidates added to an earlier list usually get a somewhat lower count than the original list.
Can I include my own controls?
Yes, as many as you like, as part of your library. They are placed at random among the test peptides. For human serum or plasma, we add positive controls that nearly every donor recognizes.
Why are the peptides placed at random?
To keep position effects out of the results. A gradient across the slide spreads over all peptides instead of hitting one group. The allocation is reproducible: the same library gets the same positions, and peptides added later keep theirs. Layouts in a predefined order are not offered.
Designing the library
What can the library contain?
Send your own list, or have the library designed from your proteins by us.
- From sequences. Combinatorial, substitution, random, truncation and deletion libraries, tiles with adjustable overlap, and alanine scans.
- From the structure. Continuous and discontinuous epitope candidates (step 4.5).
- Up to a whole proteome. Every peptide is annotated with the proteins it occurs in.
A substitution scan, a tiling, a truncation series and a combinatorial set. Schematic.
Questions about this step
Can you design the library for me?
Yes. Send the protein sequences, or name the proteins, and we design the peptides to your plan. That can be overlapping tiles along a sequence, or substitution, combinatorial, random, truncation or deletion variants. Or send your own list, and the software does the rest.
How much overlap do tiled peptides need?
A one-residue shift gives the highest resolution and is the default. A wider step shrinks the library, usually without losing epitope coverage, when more proteins must fit on the same microarray.
What is an alanine scan?
Each residue of a peptide is replaced by alanine in turn, one variant per position, so a 15-residue peptide adds 15 variants. The binding of the variants shows which residues carry the interaction.
Can the library cover a whole proteome?
Yes, up to one, within the project's capacity. The proteins are sliced into peptides, and each peptide is annotated with every protein it occurs in. A binding peptide then points to all the proteins that carry its sequence, which turns the screen into an off-target search. Filters keep a large proteome within capacity.
How can a large library be made smaller?
- Keep unique sequences only; each is annotated with every protein it belongs to.
- Keep one domain type: extracellular, transmembrane or intracellular.
- Keep surface-exposed stretches.
- Keep only the best-supported discontinuous candidates.
- Widen the tiling step.
Should several samples be tested together or one by one?
For a large library and many samples, in two rounds. First, one large library is incubated with a pool of the samples, which separates non-binders from any binders. Then only the hits go onto a multi-well microarray, and each sample is incubated on its own. Every sample is characterized individually, at the cost of one more round of synthesis.
Epitope candidates from the structure
How are discontinuous candidates made?
Most epitopes are discontinuous: stretches far apart in the sequence that fold into one surface patch. Structure-based epitope candidates, unique to Axxelera, put them on the array.
- Three candidate types. Overlapping continuous peptides, two-fragment candidates and surface-patch candidates.
- Experimental or predicted. An experimental structure where one exists, an AlphaFold model where not, or to fill its gaps.
- Checked against the structure. Candidates the fold rules out never reach the array; the others carry a confidence.
- Held in shape. Joined candidates are cyclized.
From one protein structure to the three candidate types. Illustrative.
Questions about this step
Can a peptide array map a discontinuous (conformational) epitope?
Yes, if the library is built from the structure. A linear scan tiles the sequence, so stretches that lie far apart in the chain never meet on one peptide. Candidates derived from the structure join them, and a hit names the fragments the antibody needs, drawn on the protein. An epitope that depends on the exact fold is better mapped by HDX-MS or a co-crystal structure.
Linear scan or structure-derived library?
Both, on one microarray. The overlapping scan finds continuous epitopes. The structure-derived candidates find the discontinuous epitopes that a scan overlooks: two fragments or a surface patch joined in one peptide, and cyclized to hold the shape.
Which structure do you use?
An experimental structure from the Protein Data Bank when there is one, otherwise an AlphaFold model. You can also restrict the mapping to a domain or an extracellular region.
How are two fragments joined into one candidate?
Two stretches that lie close in the structure are joined into one peptide, in the orientations their ends allow, and cyclized to hold the shape. A hit names both fragments by their residue positions.
What is a surface-patch candidate?
A peptide assembled from residues that lie next to each other on the protein surface. It captures epitopes that span a β-sheet or several helices, beyond what two fragments reach.
Why does a well-resolved structure give fewer candidates?
Because it rules out more candidates. Only those the structure supports are kept, and a complete structure leaves fewer in doubt. Disordered regions have no coordinates, so continuous candidates cover them instead.
When can the discontinuous candidates be left out?
When you are certain the antibody binds a linear stretch, or already know the region and want the exact motif. A substitution or alanine scan can then go into the first round. Otherwise keep them: the microarray has room for them from the start, which spares a second round.
Does cyclization hide the epitope from the antibody?
No. Overlapping continuous peptides present an epitope across a band of neighbors, and the joint of a two-fragment candidate faces the antibody. The caveat: a cyclic 15-mer need not reproduce the native fold, so an antibody that needs the exact 3D shape may not bind it.
Submitting sequences
How do I send my sequences?
One peptide per line, in a spreadsheet or plain text, by email.
- One-letter code. Custom residues in square brackets, for example [Cit].
- Marked per peptide. A free N-terminus, cyclization or a custom building block.
- Named for traceability. Your names are kept; derived peptides are named after their protein and residue positions.
One line of a sequence list, with a custom residue and a cyclization mark.
Questions about this step
In what format do I send the sequences?
One peptide per line, in a spreadsheet or plain text, in one-letter code. Mark per peptide what differs from the default: a free N-terminus, cyclization, or a custom building block by its code. Submit by email.
How do I write a custom amino acid?
With its code in square brackets, inside the one-letter sequence: for example [Cit] for citrulline, [Nle] for norleucine, [dA] for D-alanine. An acetylated N-terminus is written [Ac]. We send the list of available codes, and new ones are added on request.
How are peptides named in the results?
Your own names are kept. A peptide we derive from a protein is named by its type (continuous or discontinuous), the structure it came from, the protein and its residue positions. Every hit points back to its place in the sequence. A sequence found in several proteins carries all their names.
Sourcing and timeline
What happens after I order?
From project submission, the results are released on Day 14.
- The day plan. Day 0 submission, Day 1–7 synthesis, Day 8–10 assay, Day 11–13 analysis, Day 14 release.
- What the plan needs. The final library, the purchase order, the protein (labeled, if we label it) and any custom building blocks.
- Custom building blocks. Sourced per project, as material at cost.
The 14-day plan and the four things it starts from.
Questions about this step
How much of a custom building block is needed?
About 1 g per synthesis as a guide. The exact amount follows from the library: how many positions use the block, and its molecular weight. We estimate it when the library is submitted. You can send the block, or we source it at cost.
When do the 14 days start?
With the project submission: the final library and the order. The day plan then holds as long as its conditions are met: the purchase order is issued, the target protein has arrived (and is labeled, if we label it), and any custom building blocks are in the lab. Synthesis runs Day 1–7, the assay Day 8–10 and the analysis Day 11–13. The results are released on Day 14.
What arrives
How are the arrays shipped, and which side carries the peptides?
For arrays-only orders, the library is designed as in any project. We synthesize and check the arrays and ship them with the layout file for your scanner software.
- In sealed tubes. Under inert atmosphere, shipped at room temperature.
The array in its tube, peptide side up. Schematic.
Questions about this step
Can I order arrays without the assay?
Yes. Design the library as for any project. We synthesize the arrays, check them and ship them, and you run the assay in your own lab. For now, arrays-only orders go through "Send a message". Recommendations for running the assay are shared on request; most labs use their own protocol.
Which side of the slide carries the peptides?
The side on which the printed label reads the right way round.
How should I store the arrays until use?
In their sealed tubes, under inert atmosphere, at 4 to 8 °C, for up to six months from delivery. Transport at room temperature is fine.
How does my scanner software find the spots?
From the layout file (GAL) that ships with the arrays. GAL-compatible software imports it and locates each block. Control spots mark the frame of every block, and the top-left corner spot fixes the orientation.
What you need
Which reagents and equipment do I source?
A microarray lab has most of it already: buffers, detection reagents, an incubation tray, a centrifuge and a fluorescence scanner.
- Reagents. A blocking buffer, a wash buffer and your detection reagents.
- Equipment. An incubation tray that fits the layout, a microarray centrifuge and a scanner (step 5.4).
What the bench needs, without product names.
Questions about this step
What do I need to run the assay myself?
- a blocking buffer
- PBS with 0.05 % Tween 20 for washing
- an incubation tray that fits the layout
- your detection reagents, for example labeled streptavidin, or a labeled anti-HA antibody to read the controls
- a microarray centrifuge for drying
- a fluorescence scanner (step 5.4)
We share the products we use on request.
Which tray wells line up with the array?
Not all of them. The tray has more wells than the array has fields, and its outer rows fall outside the peptide area. Which rows to skip depends on the layout; we tell you for yours.
Running the assay
How do I block, incubate, wash and dry?
The sequence is the one we run in our lab: block, incubate, wash, stain if needed, wash again, dry and scan.
- Conditions. Our defaults (step 2.5) or your own.
- Keep it wet. The slide must not dry between the wet steps; drying comes last, just before the scan.
- Protease assays skip the blocking.
The same five stages as in our lab, with the drying step.
Questions about this step
How do I dry the array before scanning?
Just before the scan, evenly and without stains, in a microarray centrifuge or a stream of inert gas. Our recommendations are shared on request.
How long should the staining step be?
As short as the reagent allows. Everything between the end of the incubation and the scan gives weak binders time to dissociate: the washes, the stain and the washes after it. Our recommendations are shared on request.
Scanning and reading
Which scanner, resolution and software?
A fluorescence microarray scanner reads the arrays if it resolves the spots and has a red channel.
- 5 µm per pixel or finer. A spot is about 40 × 40 µm.
- Red channel first. Around 635 nm (step 2.3).
- GAL-compatible software. It locates the blocks from the layout file.
The same spot scanned at 10 and at 5 µm per pixel.
Questions about this step
Which scanner do I need?
A fluorescence microarray scanner with a red channel around 635 nm and a resolution of 5 µm per pixel or finer. We recommend the InnoScan 910 or 1100 (Innopsys), which have low-noise detectors and are common second-hand. A GenePix (Molecular Devices) works if it reaches the resolution.
Is 10 µm per pixel enough?
No. A spot is about 40 × 40 µm, so at 10 µm per pixel it covers only a few pixels and cannot be resolved. For an end-point readout, you can scan at 10 µm now and rescan the dried slide later at 5 µm or finer.
Which software reads the scans?
Any microarray image software that imports a GAL layout file. It extracts the signal of every spot. The analysis of chapter 3 can then run on our side (step 5.6).
What if I have no scanner?
- Ask a scanner maker (Innopsys, Molecular Devices) for access. They can usually point you to a nearby instrument.
- Run the assay yourself and send the arrays back to us for scanning. This is a one-shot assay, with little room to re-incubate.
- Isolate the antibodies from the samples with Protein A/G beads and send them, and we run the assay.
Between runs
How do I store, reuse or strip an array?
An array that has seen a sample can be stored, and with care used again.
- Cold and inert. At 4 to 8 °C, in its tube, under inert atmosphere, for up to six months from delivery.
- Reuse after stripping. Possible but not guaranteed, at some cost in sensitivity; a control scan confirms the old signal is gone.
Stored between runs, or stripped and checked before reuse. Schematic.
Questions about this step
How do I store an array between assays?
Back in its tube, sealed under inert atmosphere at 4 to 8 °C, for up to six months from delivery. After human samples this matters most: residual proteases can cleave some peptides.
Can an array be reused?
In principle, yes, after the bound protein is stripped off. Whether it works depends on the analyte and its affinity: stripping removes much, but rarely all, of the bound antibody. Reuse also lowers the sensitivity of the next run. A control scan must confirm the old signal is gone before re-probing. A fresh array remains the more reliable choice.
Sending data back
Can Axxelera analyze my scans?
Yes. Scans made in your lab go through the same analysis as the assays we run.
- What to send. The scanner exports, the layout file, the peptide list and the conditions of every well.
- What you get. Processed results and a report, as in step 3.6.
From your scan to our analysis and report.
Questions about this step
Can you analyze scans I made myself?
Yes. Send the scanner exports with the layout file, your peptide list and the conditions of every well: the protein, and its concentration or contact time. The analysis is the same as for the assays we run (chapter 3). You receive the processed results and a report.